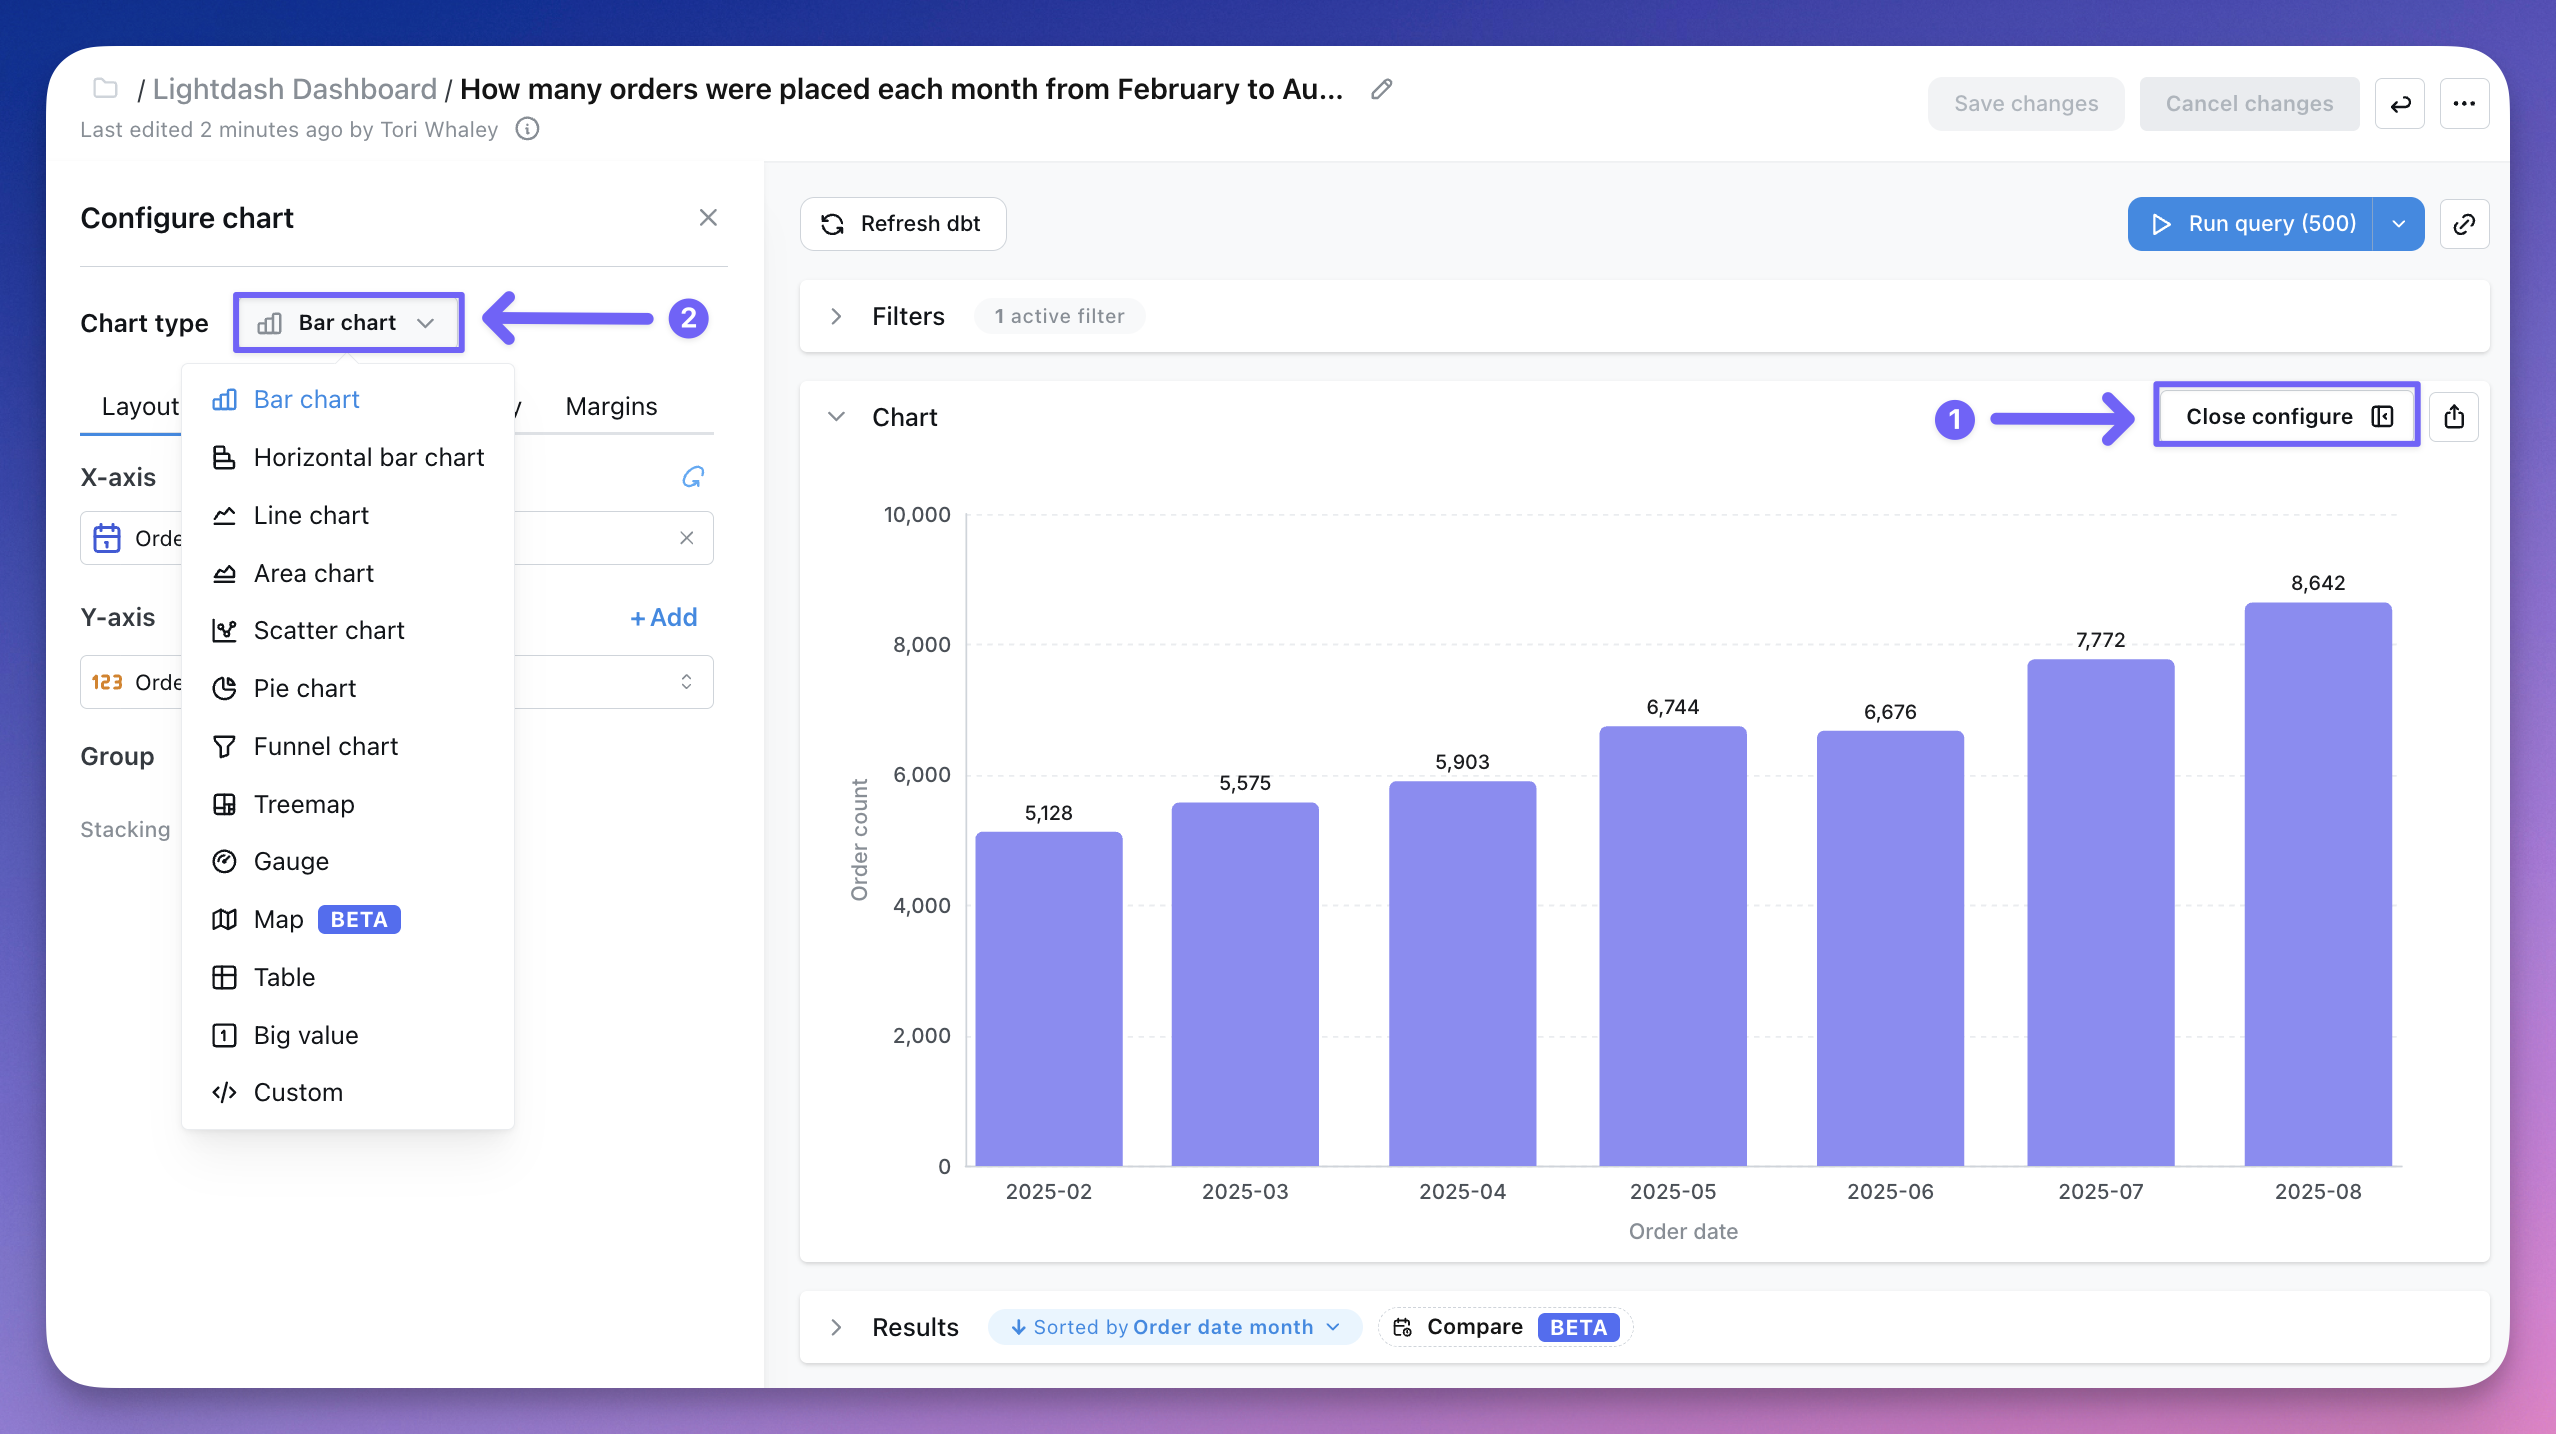
In Lightdash, the data in your results tables can be visualized in a bunch of different ways:Documentation Index
Fetch the complete documentation index at: https://lightdash-update-dbt-code-blocks.mintlify.app/llms.txt
Use this file to discover all available pages before exploring further.
- Bar chart
- Horizontal bar chart
- Line chart
- Area chart
- Mixed chart
- Scatter chart
- Pie chart
- Funnel chart
- Treemap chart
- Table
- Big value
- Gauge
- Map
- Custom chart